Building a CRC classifier

Now, we will build our CRC classifier using gut microbial data from four different cohorts: French, Italian, Austrian, and Germany. Our dataset consists of relative abundance of gut microbial communities. The dataset also cotains classification of those communities at different taxonomic levels (e.g., phylum, genus, species).

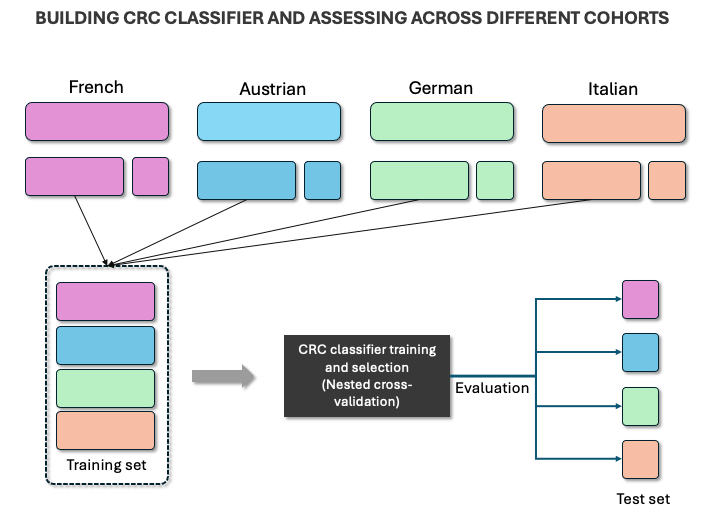
We will follow the approach depicted in Figure fig-method for building our CRC classifier. We will divide all cohorts using 70/30 split into training and test set. All training sets will be utilized for building models and selecting the one with best performance. The selected model then applied on test set from different cohorts to assess generalizability of the model across cohorts.

Figure 1: Methodology to build and assess CRC classifier

Target class distribution across cohorts

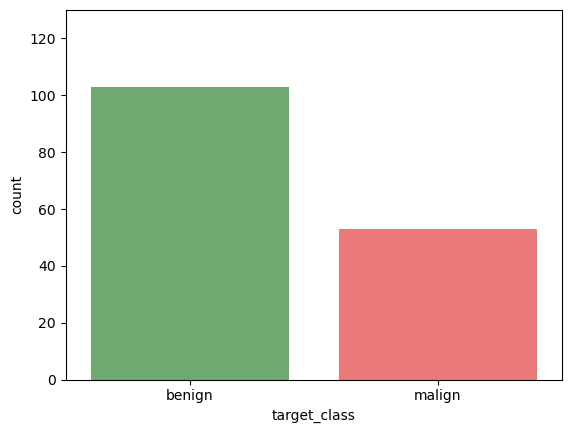
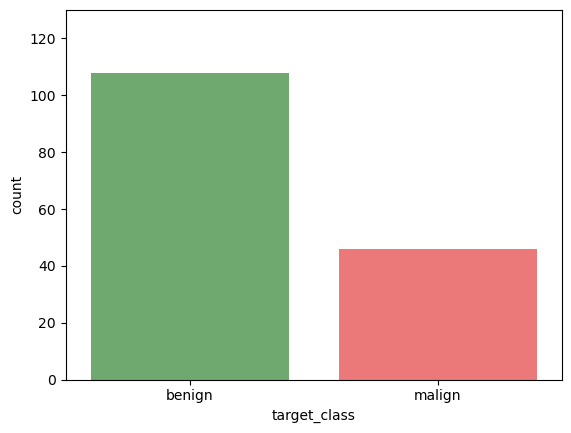
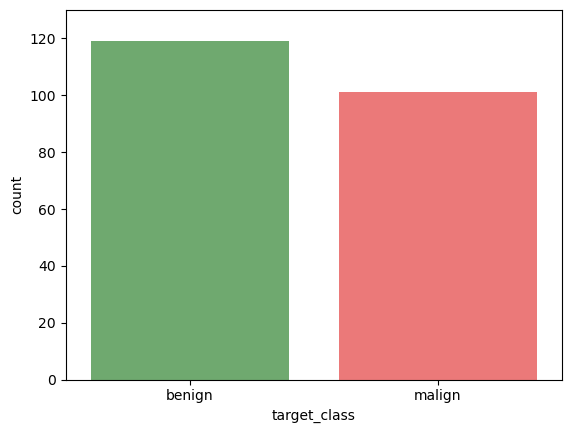
Figure fig-dist-class below shows the ditribution of target class. For our modeling task, we have grouped adenoma and control into a single class of benign tumor. While, CRC class is treated as malign tumor.

  • French and Austrian cohorts are highly skewed in terms of target class distribution, both having ~ 30% cases of CRC.
  • While, German and Italian cohorts have relatively balanced cases of malign and benign tumors.
Show the code
for country in ['france','austria','germany','italy']:
    plt.figure()
    
    # Get country specific dataset
    dataset = get_country_dataset('Nine_CRC_cohorts_taxon_profiles.tsv',country,country_dataset_mapping)

    # Plot class ditribution
    sns.countplot(data=dataset, x='target_class',alpha=.6,order=['benign','malign'],palette={'benign':'green','malign':'red'})
    plt.ylim([0,130])
    plt.show()
(a) French cohort
(b) Austrian cohort
(c) German cohort
(d) Italian cohort
Figure 2: Target class distribution in cohorts

Train and test split of dataset

We will split each of aforementioned cohort using 70/30 split rule resulting in a training set of 70% cases and a test set of 30% cases. We will use the test set only for our final evaluation of our models’ performance.

Show the code
from sklearn.model_selection import train_test_split

# List to store training and test seperately
train_X_data = []
test_X_data = []

for country in ['france','austria','germany','italy']:
    # Get country specific dataset
    dataset = get_country_dataset('Nine_CRC_cohorts_taxon_profiles.tsv',country,country_dataset_mapping)

    y = dataset['target_class']
    X = dataset.copy()
    
    # Split train and test
    train_x, test_x, train_y, test_y = train_test_split(X,y,test_size=0.20, random_state=42)
    
    # Store country
    train_x['groups'] = country
    test_x['groups'] = country
    
    # Storing train and test seperately
    train_X_data.append(train_x)
    test_X_data.append(test_x)
    
# Concatenating all country's dataset
train_X_df = pd.concat(train_X_data, axis=0)
test_X_df = pd.concat(test_X_data, axis=0)

# Preparing X and y
train_X = train_X_df.drop(['target_class'], axis=1)
train_y = train_X_df['target_class']

test_X_df.to_csv('test_X_df.csv',index=False)

Model building pipeline

The below diagram depicts our model building pipeline consisting of steps ranging from feature selection, dimensionality reduction to model selection. These steps are explained at length below.

graph TD
    A(Input Data) --> B1(Relative Abundance Filter)
    B1 --> I(Variance Threshold Filter)
    I --> C1(Feature Selection)
    A --> B2(Compute Alpha Diversity)
    A --> B3(Impute Missing Metadata Features)
    A --> B4(PCA)
    C1 --> D(Combine Features)
    B2 --> D
    B3 --> D
    B4 --> D
    D --> E(Train ML Model with Nested CV)
    E --> H(Model Selection)

Show the code
from sklearn.base import BaseEstimator, TransformerMixin
from sklearn.feature_selection import RFECV, SelectKBest, SelectFpr, f_classif, VarianceThreshold
from sklearn.linear_model import LogisticRegression
from sklearn.linear_model import LassoCV
from sklearn.utils import resample

from sklearn.preprocessing import StandardScaler, MinMaxScaler
from sklearn.model_selection import GridSearchCV, StratifiedKFold
from sklearn.metrics import roc_auc_score, accuracy_score, precision_score, recall_score, roc_curve, auc

from sklearn.linear_model import Lasso
from sklearn.tree import DecisionTreeClassifier
from sklearn.ensemble import RandomForestClassifier
from sklearn.pipeline import Pipeline
from sklearn.pipeline import FeatureUnion


# Creating custom pipeline processor
class ColumnSelector(BaseEstimator, TransformerMixin):
    """
    Custom selector based of feature names for pipeline
    """
    def __init__(self, variables):
        self.variables = variables
    
    def fit(self, X, y = None):
        return self
    
    def transform(self, X):
        X_dropped = X[self.variables]
        return X_dropped
    
    
class RelativeAbundanceFilter(BaseEstimator, TransformerMixin):
    """
    Custom selector based on relative abundance filtering
    """
    def __init__(self, threshold):
        self.threshold = threshold
        self.columns_select = None
        
    def fit(self, X, y=None):
        self.columns_to_select = X.columns[X.max(axis=0) > self.threshold]
        return self
    
    def transform(self, X):
        X_selected = X[self.columns_to_select]
        return X_selected
    
    
class VarianceThresholdFilter(BaseEstimator, TransformerMixin):
    """
    Custom selector based on relative abundance filtering
    """
    def __init__(self, threshold=0.0):
        self.threshold = threshold
        self.transformer = VarianceThreshold(self.threshold)
        
    def fit(self, X, y=None):
        self.transformer.fit(X,y)
        return self
    
    def transform(self, X):
        X_filtered = self.transformer.transform(X)
        return X_filtered
    
    
class FeatureSelector(BaseEstimator, TransformerMixin):
    """
    Select top k features based on specified strategy
    """
    def __init__(self, cv=10):
        self.estimator = LassoCV(cv=cv)
        self.feature_coef = pd.DataFrame()
        
    def fit(self, X, y=None):
        self.feature_coef.columns = X.columns
        
        for sample in resample(X,y):
            self.estimator.fit(X,y, random_state=42)
            coef_df = pd.DataFrame(self.estimator.coef_, columns=X.columns)
            self.feature_coef = pd.concat([self.feature_coef, coef_df], axis=0, ignore_index=True)
            
        return self
    
    def transform(self, X):
        X_selected = self.feature_selector.transform(X)
        df = pd.DataFrame(X_selected, columns=self.feature_names_out)
        
        return df
    
        
class AlphaFeatureExtender(BaseEstimator, TransformerMixin):
    """
    Custom transformer to extend relative abundace data with alpha diversity measure
    """
    def __init__(self):
        pass
    
    def fit(self, X, y=None):
        return self
    
    def transform(self, X):
        # Create an empty dataframe
        diversity_measures = pd.DataFrame()

        # alpha diversty measures
        alpha_diversity_metrics = [
            "chao1",
            "shannon",
            "simpson",
            "simpson_e",
            "fisher_alpha",
            "berger_parker"
        ]

        # Compute alpha diversity measures
        shannon_diversity = X.apply(lambda x: alpha.shannon(x), axis=1)
        chao1_diversity   = X.apply(lambda x: alpha.chao1(x), axis=1)
        simpson_diversity   = X.apply(lambda x: alpha.simpson(x), axis=1)
        simpson_e_diversity   = X.apply(lambda x: alpha.simpson_e(x), axis=1)
        fisher_diversity   = X.apply(lambda x: alpha.fisher_alpha(x), axis=1)
        berger_parker_diversity   = X.apply(lambda x: alpha.berger_parker_d(x), axis=1)

        # Add alpha measures to the dataframe
        diversity_measures['shannon'] = shannon_diversity
        diversity_measures['chao1'] = chao1_diversity
        diversity_measures['simpson'] = simpson_diversity
        diversity_measures['simpson_e'] = simpson_e_diversity
        diversity_measures['fisher_alpha'] = fisher_diversity
        diversity_measures['berger_parker'] = berger_parker_diversity

        return diversity_measures

    
class MetaDataImputer(BaseEstimator, TransformerMixin):
    """
    Imputer for specific metadata (i.e., age, genger, BMI)
    """
    def __init__(self):
        self.fill_values = dict()

    
    def fit(self, X, y=None):
        X['age'] = pd.to_numeric(X['age'], errors='coerce')
        X['BMI'] = pd.to_numeric(X['BMI'], errors='coerce')
        
        self.fill_values['age'] = X['age'].mean()
        self.fill_values['BMI'] = X['BMI'].mean()
        self.fill_values['gender'] = X['gender'].mode().values[0]
        return self
    
    def transform(self, X):
        if X['age'].dtype == 'O':
            X['age'] = pd.to_numeric(X['age'], errors='coerce')

        if X['BMI'].dtype == 'O':
            X['BMI'] = pd.to_numeric(X['BMI'], errors='coerce')
        
        for col in X.columns:
            X[col] = X[col].fillna(self.fill_values[col])
        X['gender'] = X['gender'].map({'female':0, 'male':1})
        return X
    
     
def prepare_dataset(X, return_mapping=False):
    """
    This function prepare dataframe for modeling task
    """
    
    otu, taxa = get_otu_table(X)   
    metadata = get_metadata(X,['age','gender','BMI'])

    for col in otu.columns:
        otu[col] = otu[col].astype('float32')
        
    metadata['age'] = pd.to_numeric(metadata['age'], errors='coerce')
    metadata['BMI'] = pd.to_numeric(metadata['BMI'], errors='coerce')
    
    y= X['target_class'].map({'benign':0,'malign':1})
    y.reset_index(drop=True, inplace=True)    
    otu.reset_index(drop=True, inplace=True)
    
    otu_to_species = taxa['species'].to_dict()
    
    X_ = pd.concat([otu, metadata], axis=1)
    if return_mapping:
        return X_, y, otu_to_species
    else:
        return X_, y

Applying filters to reduce feature space

We will start by reducing feature spaces through the following three steps.

  1. Relative abundance filter
  2. Variance threshold filter
  3. Best features selection using Lasso
Show the code
from sklearn.preprocessing import FunctionTransformer
from sklearn.decomposition import PCA

def log(x):
    return np.log(x+.000001)

# Prepare dataset for modeling
X, y, m = prepare_dataset(train_X_df, return_mapping=True)

# Create list of otus columns
otu_columns = [item for item in X.columns if item not in ['age','gender','BMI']]

# Pipeline for filtering
abundance_processing =  Pipeline([
                    ('abundance',ColumnSelector(otu_columns)),
                    ('relative',RelativeAbundanceFilter(threshold=.001)),
                    ('variance', VarianceThresholdFilter()),
                    ('log', FunctionTransformer(log)),
                    ('standard', MinMaxScaler())
                    ])

# Pipeline for computing alpha diversity
alpha_processing = Pipeline([
    ('abundance', ColumnSelector(otu_columns)),
    ('alpha_extended', AlphaFeatureExtender())
])

# Pipeline for imputing metadata
meta_processing = Pipeline([
    ('meta_columns', ColumnSelector(['age','BMI','gender'])),
    ('meta_imputer', MetaDataImputer())
])

# Pipeline for PCA
pca_processing = Pipeline([
    ('abundance',ColumnSelector(otu_columns)),
    ('pca',PCA()),
])

# Concatenating results 
combined_features = FeatureUnion([
    ('abun_part', abundance_processing),
    ('alpha_part', alpha_processing),
    ('meta_part', meta_processing),
    ('pca_part',pca_processing),
])

# Create full pipeline
full_pipeline = Pipeline([
    ('combined_part', combined_features),
    ('select_part', ColumnSelector(final_features)),
    ('train', LogisticRegression(C=.1, penalty='l1',solver='liblinear')),
     ]
)

full_pipeline.fit(X,y)
Pipeline(steps=[('combined_part',
                 FeatureUnion(transformer_list=[('abun_part',
                                                 Pipeline(steps=[('abundance',
                                                                  ColumnSelector(variables=['OTU_0',
                                                                                            'OTU_1',
                                                                                            'OTU_2',
                                                                                            'OTU_3',
                                                                                            'OTU_4',
                                                                                            'OTU_5',
                                                                                            'OTU_6',
                                                                                            'OTU_7',
                                                                                            'OTU_8',
                                                                                            'OTU_9',
                                                                                            'OTU_10',
                                                                                            'OTU_11',
                                                                                            'OTU_12',
                                                                                            'OTU_13',
                                                                                            'OTU_14',
                                                                                            'OTU_15',
                                                                                            'OTU_16',
                                                                                            'OTU_17',
                                                                                            'OTU_18',
                                                                                            'OTU_19',
                                                                                            'OTU_20',
                                                                                            'OTU_21',
                                                                                            'OTU_22',
                                                                                            'OTU_23',
                                                                                            'OTU_24',
                                                                                            'OT...
                 ColumnSelector(variables=['OTU_16', 'OTU_28', 'OTU_108',
                                           'OTU_111', 'OTU_144', 'OTU_153',
                                           'OTU_157', 'OTU_158', 'OTU_161',
                                           'OTU_178', 'OTU_218', 'OTU_348',
                                           'OTU_353', 'OTU_367', 'OTU_372',
                                           'OTU_375', 'OTU_378', 'OTU_381',
                                           'OTU_388', 'OTU_446', 'OTU_464',
                                           'OTU_465', 'OTU_466', 'OTU_468',
                                           'OTU_470', 'OTU_503', 'OTU_535',
                                           'OTU_544', 'OTU_546', 'OTU_547', ...])),
                ('train',
                 LogisticRegression(C=0.1, penalty='l1', solver='liblinear'))])
In a Jupyter environment, please rerun this cell to show the HTML representation or trust the notebook.
On GitHub, the HTML representation is unable to render, please try loading this page with nbviewer.org.
Show the code
from imblearn.over_sampling import RandomOverSampler
from numpy.random import RandomState
from sklearn.feature_selection import SelectKBest

# Feature selection process
df_coef = pd.DataFrame()

feature_set = []

for i in range(100):
    sampler = RandomOverSampler(sampling_strategy=np.random.choice([1]), random_state=RandomState())
    sample_X, sample_y = sampler.fit_resample(X_features, y)

    sel = SelectKBest(k=100)
    X_selected = sel.fit_transform(sample_X, sample_y)

    feature_set += list(X_selected.columns)
 
#import collections
#counter = collections.Counter(feature_set)
#final_features = [item[0] for item in counter.most_common(40)]

X_final = X_features[final_features]

lasso_param_grid = {
    "lasso__C": [0.001, .01, .1, 1, 10, 100],
}

dt_param_grid = {
    "dt__max_depth": [3,4,5,6],
    "dt__criterion":['gini','entropy'],
    "dt__min_samples_split":[2,4,6,8,10]
}

rf_param_grid = {
    "rf__n_estimators":[50,100,150,200],
    "rf__max_depth":[3,4,5,6],
    
}

lasso_pipe = Pipeline([
    ('scaler',StandardScaler()),
    ('lasso', LogisticRegression(penalty='l1',solver='liblinear', max_iter=10000))
])

dt_pipe = Pipeline([
    ('dt', DecisionTreeClassifier())
])

rf_pipe = Pipeline([
    ('scaler',StandardScaler()),
    ('rf', RandomForestClassifier())
])
Show the code

def build_classifier(pipeline, param_grid, X,y, outer_cv=None, inner_cv=None):
    """
    This builds CRC classifier using nested cross-validation and print hyperparameters of the model.

    Args:
    -----
        model (sklearn model): machine learning model object
        
        param_grid (dict): parameters grid to search optimized parameters
        
        X (dataframe): pandas dataframe of dataset
        
        y (list): target class
        
        inner_cv_scoring (int): number of folds for inner cross-validation
        
        outer_cv_scoring (int): number of folds for outer cross-validation
        

    Returns:
    -----
        classifier (sklearn trained model)
    """
    
    # Outer validation: 10-fold cross-validation
    if outer_cv is None:
        outer_cv = StratifiedKFold(n_splits=10, shuffle=True, random_state=42)

    # Inner validation: 5-fold cross-validation for hyperparameter tuning
    if inner_cv is None:
        inner_cv = StratifiedKFold(n_splits=5, shuffle=True, random_state=42)

    
    aucs = []
    best_performance = 0
    best_estimator = None

    X = X.reset_index(drop=True)
    y = y.reset_index(drop=True)

    # Nested cross-validation
    for fold, (train_idx, test_idx) in enumerate(outer_cv.split(X, y), start=1):
        X_train, X_test = X.iloc[train_idx,:], X.iloc[test_idx,:]
        y_train, y_test = y[train_idx], y[test_idx]

        # Perform GridSearchCV with 10-fold cross-validation
        grid_search = GridSearchCV(
            pipeline, param_grid, scoring='roc_auc_ovr', cv=inner_cv, n_jobs=-1
        )

        # searching parameters first
        grid_search.fit(X_train, y_train)

        # Best model and hyperparameter
        best_model = grid_search.best_estimator_
        #print(f"Best Hyperparameter: {grid_search.best_params_}")

        # Fit the model and predict probabilities
        best_model.fit(X_train, y_train)
        y_prob = best_model.predict_proba(X_test)


        fpr, tpr, _ = roc_curve(y_test, y_prob[:,1])
        roc_auc = auc(fpr, tpr)
        
        if roc_auc > best_performance:
            best_estimator = best_model
            best_performance = roc_auc
        
        aucs.append(roc_auc)
        #print(f"  performance={roc_auc:.2f}")

    return best_estimator, best_performance, np.std(aucs)
Show the code

clf, per, st = build_classifier(lasso_pipe, lasso_param_grid, X_final, y)

print(f' Best estimator (performance={per:.2f}):')
print(clf)
 Best estimator (performance=0.96):
Pipeline(steps=[('scaler', StandardScaler()),
                ('lasso',
                 LogisticRegression(C=0.1, max_iter=10000, penalty='l1',
                                    solver='liblinear'))])
Show the code
clf, per, st = build_classifier(dt_pipe, dt_param_grid, X_final, y)

print(f' Best dt estimator (performance={per:.2f}±{st:.2f}):')
print(clf)
 Best dt estimator (performance=0.89±0.09):
Pipeline(steps=[('dt',
                 DecisionTreeClassifier(criterion='entropy', max_depth=4,
                                        min_samples_split=10))])
Show the code
clf, per, st = build_classifier(rf_pipe, rf_param_grid, X_final, y)

print(f' Best rf estimator (performance={per:.2f}±{st:.2f}):')
print(clf)
 Best rf estimator (performance=0.96±0.07):
Pipeline(steps=[('scaler', StandardScaler()),
                ('rf', RandomForestClassifier(max_depth=6, n_estimators=200))])

Best models

We selected three different machine learning models based on their performance on entire dataset. The models were evluated in a nested cross-validation. The outer cross-validation (10-fold) was used for model performance while the inner cross-validation (5-fold) was used for hyperparameter tuning.

  1. LogisticRegression(C=.1) .96 AUC
  2. DecisionTreeClassifier(criterion=entropy, max_depth=4, min_samples_split=10) AUC= 0.83±0.09
  3. RandomForestClassifier(max_depth=6, n_estimators=200) AUC = 0.93±0.07
Show the code
lg = LogisticRegression(C=.1, penalty='l1',solver='liblinear')
dt = DecisionTreeClassifier(criterion='entropy', max_depth=4, min_samples_split=10) 
rf = RandomForestClassifier(max_depth=6, n_estimators=200)

Model performance of selected model using LeaveOneGroupOut

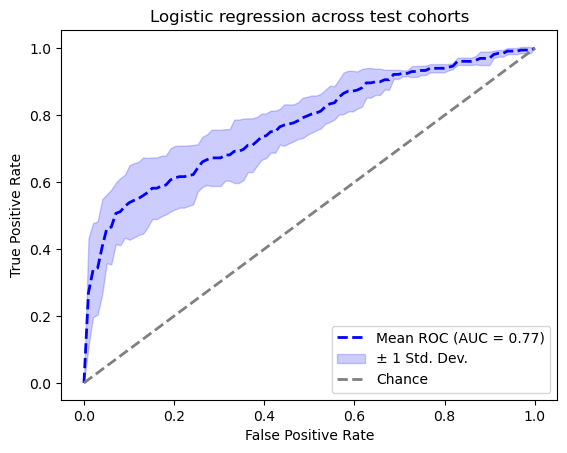
We will now assess these models using leavel-one-group-out strategy. In this strategy, we will keep a cohort for testing while other cohorts datasets will be used for training. This will give us a better idea about our models’ performance.

Show the code
from sklearn.model_selection import LeaveOneGroupOut

def perform_logo(estimator, X, y, groups,title=''):
    """
    This function performs Leave-one-group-out evaluation of the model.
    """
    
    tprs = []
    aucs = []
    mean_fpr = np.linspace(0, 1, 100)
    aucs = []
    best_performance = 0
    best_estimator = None
    
    logo = LeaveOneGroupOut()
    
    # Nested cross-validation
    for fold, (train_idx, test_idx) in enumerate(logo.split(X, y,groups)):
        X_train, X_test = X.iloc[train_idx,:], X.iloc[test_idx,:]
        y_train, y_test = y[train_idx], y[test_idx]
    
        estimator.fit(X_train, y_train)
        
        y_prob = estimator.predict_proba(X_test)

        fpr, tpr, _ = roc_curve(y_test, y_prob[:,1])
        interp_tpr = np.interp(mean_fpr, fpr, tpr)
        interp_tpr[0] = 0.0
        tprs.append(interp_tpr)
        roc_auc = auc(fpr, tpr)

        aucs.append(roc_auc)
        
    # Average AUC across classes
    mean_auc = np.mean(aucs)

    # Plot the mean ROC curve
    # Calculate mean and standard deviation of TPRs
    mean_tpr = np.mean(tprs, axis=0)
    std_tpr = np.std(tprs, axis=0)
    
    # Plot the mean ROC curve
    plt.plot(mean_fpr, mean_tpr, color='blue', linestyle='--', lw=2, label=f'Mean ROC (AUC = {mean_auc:.2f})')

    # Fill the area between the mean TPR and ±1 standard deviation
    plt.fill_between(mean_fpr, mean_tpr - std_tpr, mean_tpr + std_tpr, color='blue', alpha=0.2, label='± 1 Std. Dev.')

    # Plot the random chance line
    plt.plot([0, 1], [0, 1], linestyle='--', color='gray', lw=2, label='Chance')

    # Finalize the plot
    plt.title(title)
    plt.xlabel('False Positive Rate')
    plt.ylabel('True Positive Rate')
    plt.legend(loc='lower right')
    #plt.grid(alpha=0.3)
    plt.show()
Show the code
train_X, train_y = prepare_dataset(train_X_df)
test_X, test_y = prepare_dataset(test_X_df)

full_pipeline.fit(train_X, train_y)
Pipeline(steps=[('combined_part',
                 FeatureUnion(transformer_list=[('abun_part',
                                                 Pipeline(steps=[('abundance',
                                                                  ColumnSelector(variables=['OTU_0',
                                                                                            'OTU_1',
                                                                                            'OTU_2',
                                                                                            'OTU_3',
                                                                                            'OTU_4',
                                                                                            'OTU_5',
                                                                                            'OTU_6',
                                                                                            'OTU_7',
                                                                                            'OTU_8',
                                                                                            'OTU_9',
                                                                                            'OTU_10',
                                                                                            'OTU_11',
                                                                                            'OTU_12',
                                                                                            'OTU_13',
                                                                                            'OTU_14',
                                                                                            'OTU_15',
                                                                                            'OTU_16',
                                                                                            'OTU_17',
                                                                                            'OTU_18',
                                                                                            'OTU_19',
                                                                                            'OTU_20',
                                                                                            'OTU_21',
                                                                                            'OTU_22',
                                                                                            'OTU_23',
                                                                                            'OTU_24',
                                                                                            'OT...
                 ColumnSelector(variables=['OTU_16', 'OTU_28', 'OTU_108',
                                           'OTU_111', 'OTU_144', 'OTU_153',
                                           'OTU_157', 'OTU_158', 'OTU_161',
                                           'OTU_178', 'OTU_218', 'OTU_348',
                                           'OTU_353', 'OTU_367', 'OTU_372',
                                           'OTU_375', 'OTU_378', 'OTU_381',
                                           'OTU_388', 'OTU_446', 'OTU_464',
                                           'OTU_465', 'OTU_466', 'OTU_468',
                                           'OTU_470', 'OTU_503', 'OTU_535',
                                           'OTU_544', 'OTU_546', 'OTU_547', ...])),
                ('train',
                 LogisticRegression(C=0.1, penalty='l1', solver='liblinear'))])
In a Jupyter environment, please rerun this cell to show the HTML representation or trust the notebook.
On GitHub, the HTML representation is unable to render, please try loading this page with nbviewer.org.
Show the code
from sklearn import metrics

test_y_proba = full_pipeline.predict_proba(test_X)[:,1]

metrics.RocCurveDisplay.from_estimator(full_pipeline, train_X, train_y)
metrics.RocCurveDisplay.from_estimator(full_pipeline, test_X, test_y)
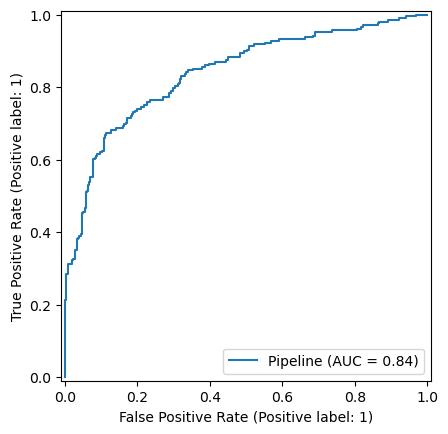
(a) Train
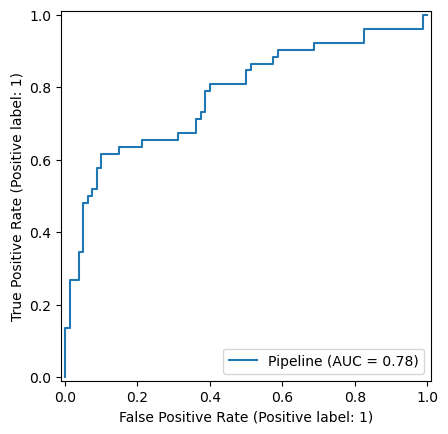
(b) Test
Figure 3: Lasso model performance
Show the code
groups = train_X_df['groups'].map({'france':0,'austria':1,'germany':2,'italy':3})
groups = groups.reset_index(drop=True)
Show the code
#train_X, train_y, transformer = prepare_dataset(train_X_df)

perform_logo(full_pipeline, X, y, groups,'Logistic regression across test cohorts')
#perform_logo(dt, train_X,train_y, groups,'Decision tree across cohorts (training)')
#perform_logo(rf, train_X,train_y, groups,'Random forest across cohorts (training)')
Figure 4: Logistic regression

Model training performance across cohorts (LOGO)

Model performance on test data from different cohorts

Now, we will evaluate our trained model which were trained using data from different cohorts. This evaluation is done on a seperate dataset which was kept aside earlier.

Show the code
lg.fit(train_X, train_y)
dt.fit(train_X, train_y)
rf.fit(train_X, train_y)
RandomForestClassifier(max_depth=6, n_estimators=200)
In a Jupyter environment, please rerun this cell to show the HTML representation or trust the notebook.
On GitHub, the HTML representation is unable to render, please try loading this page with nbviewer.org.
Show the code
train_pre_X, train_y = prepare_dataset(train_X_df)

combined_features.fit(train_pre_X, train_y)

train_X = combined_features.transform(train_pre_X)
Show the code
from sklearn.metrics import RocCurveDisplay

estimator = lg

mean_fpr = np.linspace(0, 1, 100)
cn_test_set = test_X_df.loc[test_X_df['country']=='ITA',:]
cn_test_pre_X, cn_test_y = prepare_dataset(cn_test_set)
cn_test_X = combined_features.transform(cn_test_pre_X)
y_prob = estimator.predict_proba(cn_test_X)
fpr, tpr, _ = roc_curve(cn_test_y, y_prob[:,1])
roc_auc = auc(fpr, tpr)
interp_tpr = np.interp(mean_fpr, fpr, tpr)
interp_tpr[0] = 0.0

# Plot the mean ROC curve
plt.plot(mean_fpr, interp_tpr, color='blue', linestyle='--', lw=2, label=f'French (AUC = {roc_auc:.2f})')
plt.legend()