This post is in continuation with the previous post which presented a preliminary idea on building open learner models using Bayesian networks. The last post used the vara dataset partly and analyzed that data with some synthetically generated skill-related data. This post extends that idea with the vara dataset and actual skill-related dataset.
1 Dataset
Our dataset includes two separate CSV files: one for log interaction data and another for task-to-skill mapping. These two datasets are explained in detail below.
1.1 Log dataset
We have a dataset that captured students’ interactions with the Vara platform. This dataset contains information such as number of attempts taken by a student, whether the student answered correctly or not, etc. The dataset has such information for several tasks which are grouped into activities. A sample of the dataset is shown below.
Code
import pandas as pdimport numpy as npdata = pd.read_csv('instructional-trajectory-session-24-results.csv')data.head()
Student
Time spent
Last completed
Harilik murd
Meenutamine
Used supportive materials
1. digitund_harilik murd_ASK1: meenutamine
Required
Time spent in seconds
Number of retries
...
Score.103
Answer (left empty if library is not supported).103
Answer (left empty if library is not supported).104
0
Piret Koppel
49m 46s
NaN
E1
A1
0
T1
Yes
NaN
0
...
NaN
NaN
T5
Yes
NaN
0
0
No
NaN
NaN
1
Peetri kooli kasutaja 56
983h 30m
NaN
E1
A1
0
T1
Yes
228.0
2
...
NaN
NaN
T5
Yes
NaN
0
0
No
NaN
NaN
2
Peetri kooli kasutaja 57
983h 31m 33s
NaN
E1
A1
0
T1
Yes
177.0
1
...
NaN
NaN
T5
Yes
NaN
0
0
No
NaN
NaN
3
Peetri kooli kasutaja 58
983h 28m 49s
NaN
E1
A1
0
T1
Yes
10.0
5
...
NaN
NaN
T5
Yes
NaN
0
0
No
NaN
NaN
4
Peetri kooli kasutaja 59
843h 35m 32s
NaN
E1
A1
0
T1
Yes
48.0
2
...
NaN
NaN
T5
Yes
NaN
0
0
No
NaN
NaN
5 rows × 911 columns
1.2 Skill dataset
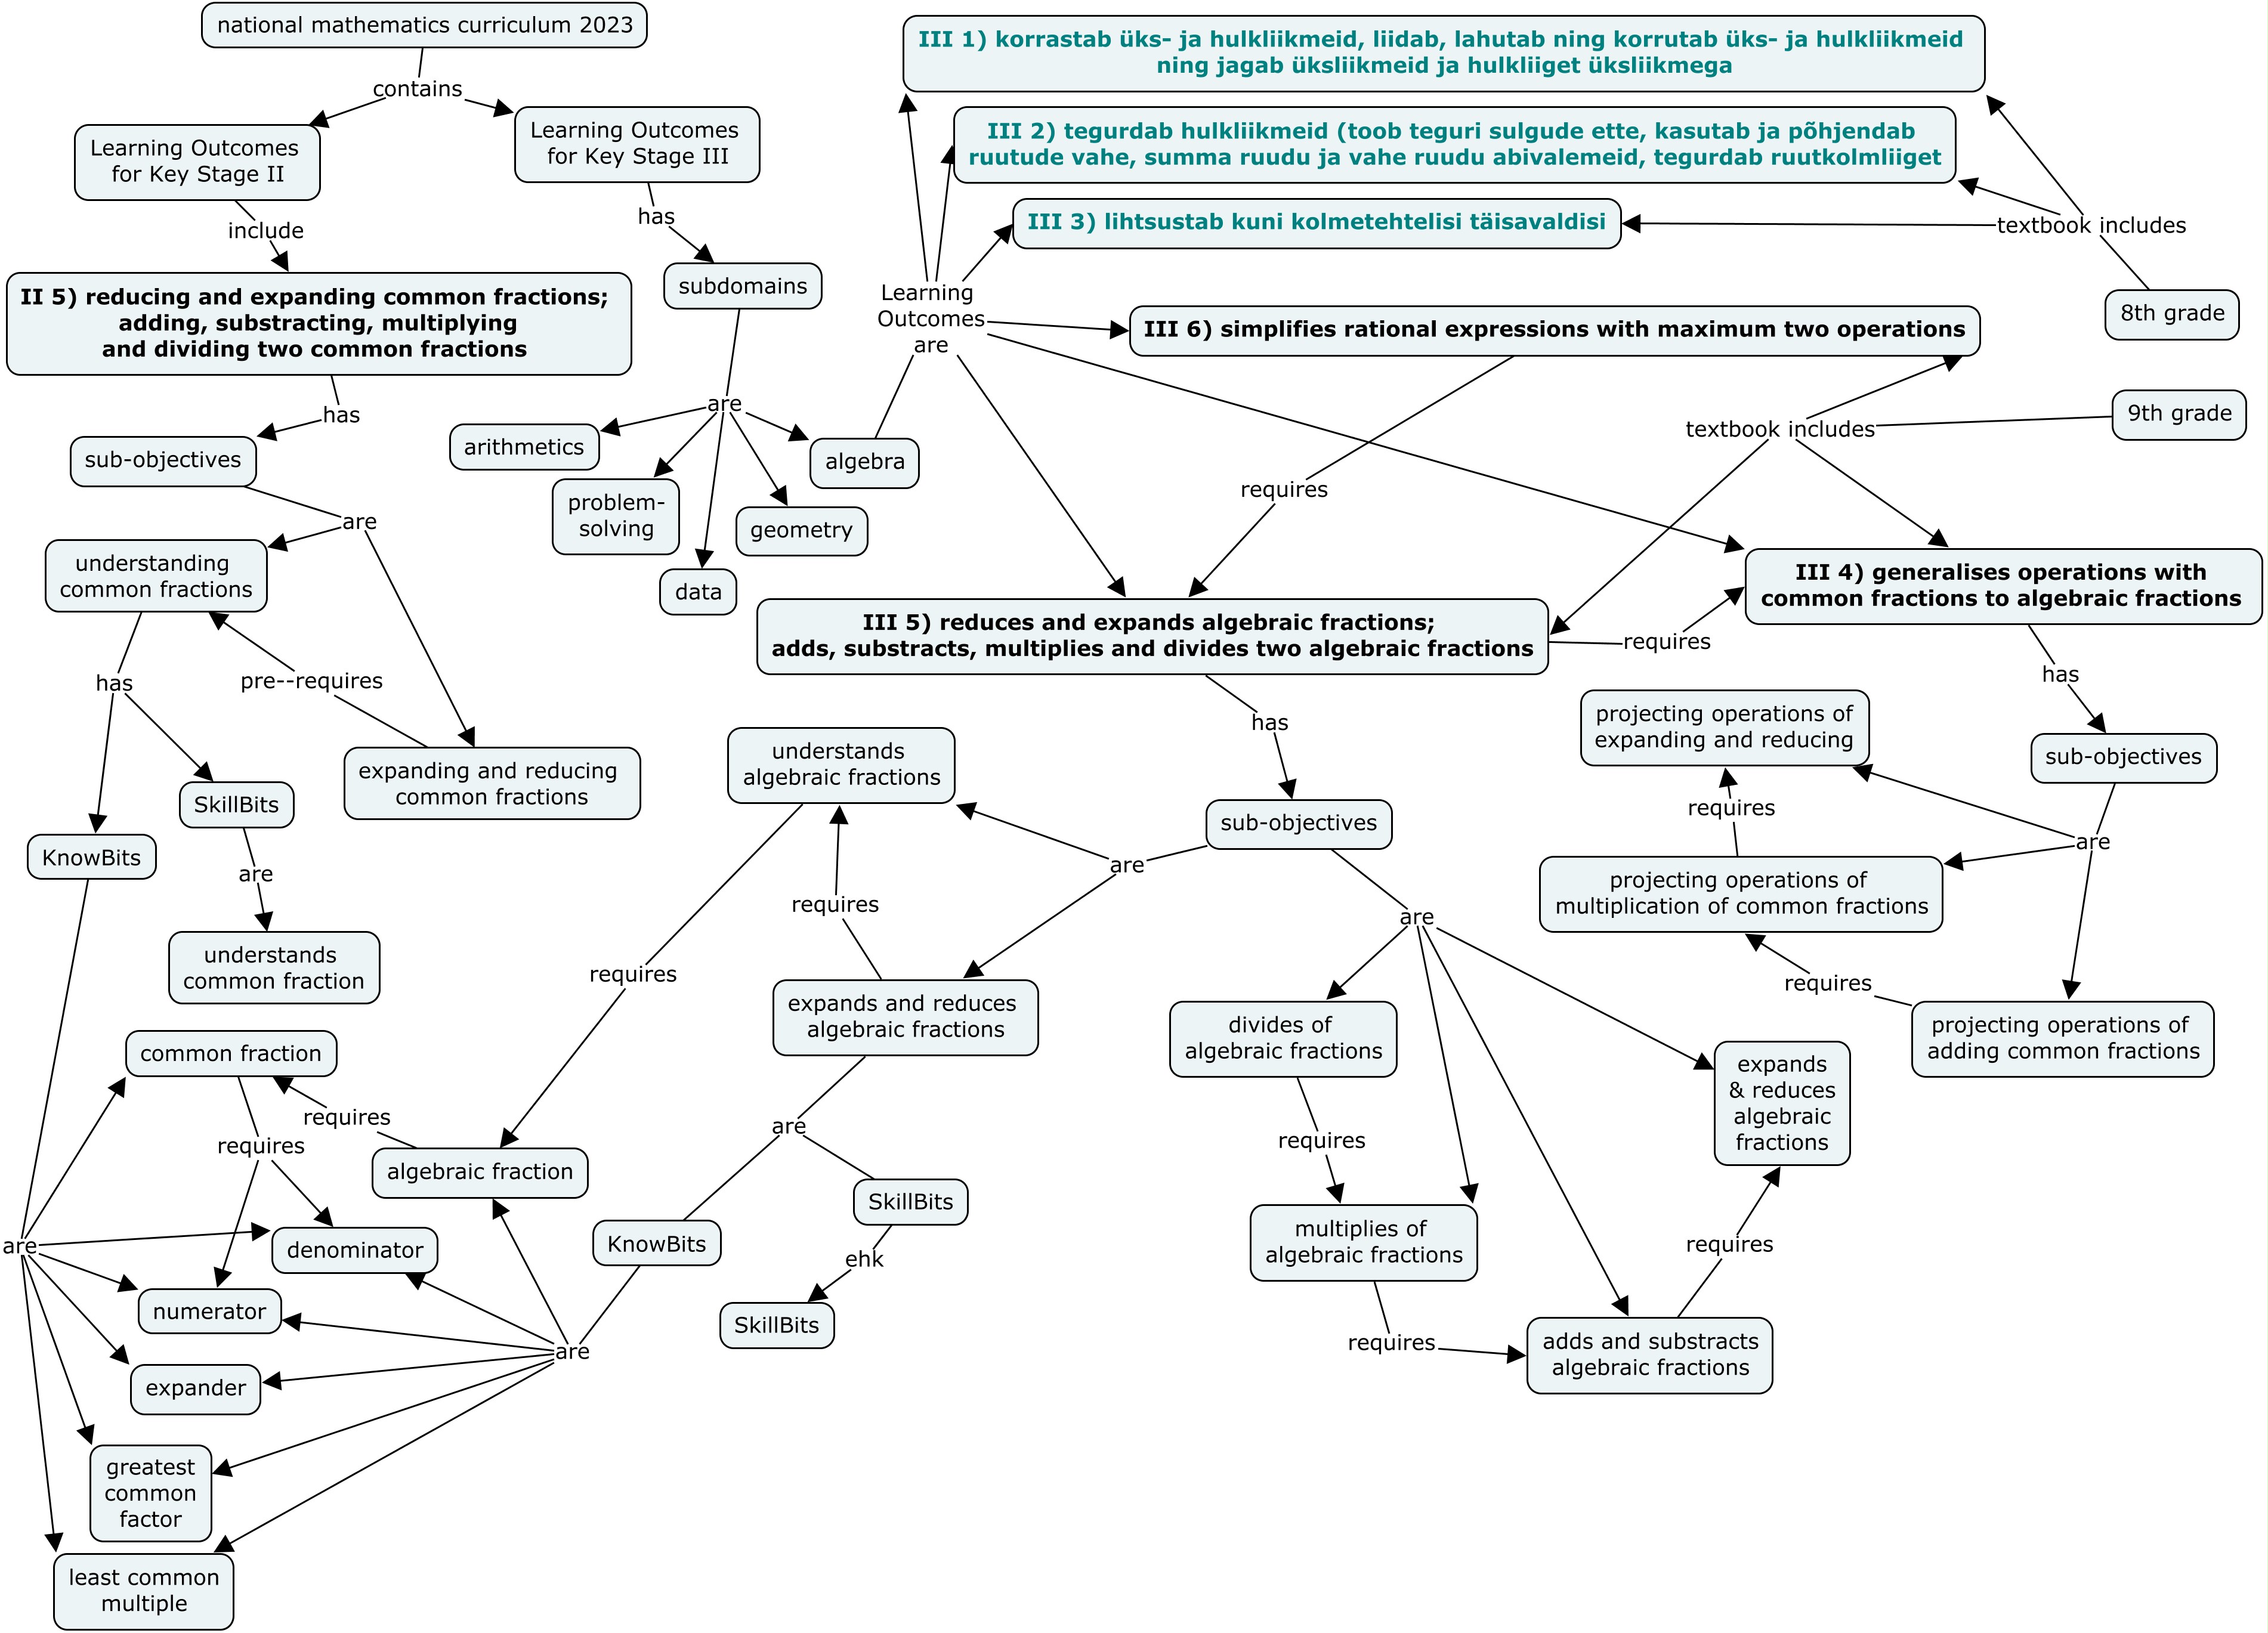
Additionally, we have also mapping data for each task to one or more skills. For example, a task is associated with the skill understanding common fractions which is part of a high-level skill II 5) reducing and expanding common fractions; adding, subtracting, multiplying and dividing two common fractions.
As the skills presented above depend on other skills, we will use that knowledge while building a knowledge network structure.
The Figure 1 presents that dependency structure among skills and it also breaks down skills at finer level. Please don’t feel overwhelmed by the amount of information presented in the figure. This is just to provide an example of a dependency structure. We will use only some part of the information from this figure (we will discuss it in detail later).
As an example, we can see that II 5) reducing and expanding common fractions; adding, subtracting, multiplying and dividing two common fractions has several skills and one of them is understanding common fractions which is a pre-requisite for another skill expanding and reducing common fractions.
Figure 1: Skills structure
2 Pre-processing data
Using the number of attempts and success features: For this example, we are going to use two types of features: 1) number of attempts and 2) success. The first feature captures the number of times a student interacted with a particular task. The second feature shows whether the response was correct or not.
Code
def extract_data(row_data):""" This function process records from log data obtained from vara on instructional trajectories. Args: row_data (dict): row record in dictionary format Returns: records : a dictionary containing processed records """ labels = {0:'required',1:'time',2:'attempts',3:'hints',4:'success',5:'score',6:'answer',7:'---'} current_episode ='' current_activity ='' current_task ='' records = {}for item in row_data: current_record = {} item =str(item)if'E'in item and'H5P'notin item: current_episode = item current_activity ='' current_task =''elif'A'in item and'H5P'notin item: current_activity = item current_task=''elif'T'in item and'H5P'notin item: current_task = item start =0elif'H5P'in item or'library'in item or':'in item:continueelse:if current_episode ==''or current_activity ==''or current_task =='':continueelse:ifnot start >6: records[f'{current_episode}_{current_activity}_{current_task}_{labels[start]}'] = item start +=1 save_records = {} processed_record = recordsfor key, value in processed_record.items(): parts = key.split('_') heirarchy ='_'.join(parts[:3])if heirarchy notin save_records.keys(): save_records[heirarchy] = {} save_records[heirarchy][parts[3]] = valuereturn save_recordsdef get_attempts_success(data):""" This function extracts attempts and success features for each task and returns a dataframe. Args: data (DataFrame): Pandas dataframe of log data Returns: DataFrame: Pandas dataframe with attempts and success features for each task """ temp = extract_data(data.iloc[1])# preparing columns for resultant dataframe column_labels = []for key in temp: column_labels.append(f'{key}_attempts') column_labels.append(f'{key}_success') df = pd.DataFrame(columns=column_labels)#for index in data.index: record = data.iloc[index] processed_record = extract_data(record) record_dict = {}for key in processed_record: record_dict[f'{key}_attempts'] = processed_record[key]['attempts'] record_dict[f'{key}_success'] = processed_record[key]['success'] dict_df = pd.DataFrame(record_dict, index=[0]) df = pd.concat([df, dict_df],axis=0)return dfdf = get_attempts_success(data)df.head()
E1_A1_T1_attempts
E1_A1_T1_success
E1_A1_T2_attempts
E1_A1_T2_success
E1_A2_T1_attempts
E1_A2_T1_success
E1_A2_T2_attempts
E1_A2_T2_success
E1_A2_T3_attempts
E1_A2_T3_success
...
E12_A3_T1_attempts
E12_A3_T1_success
E12_A3_T2_attempts
E12_A3_T2_success
E12_A3_T3_attempts
E12_A3_T3_success
E12_A3_T4_attempts
E12_A3_T4_success
E12_A3_T5_attempts
E12_A3_T5_success
0
0
No
0
No
0
No
0
No
0
No
...
0
No
0
No
0
No
0
No
0
No
0
2
No
0
No
0
No
0
No
0
No
...
2
Yes
2
Yes
0
No
0
No
0
No
0
1
No
0
No
0
No
0
No
0
No
...
0
No
0
No
0
No
0
No
0
No
0
5
No
0
No
0
No
0
No
0
No
...
0
No
0
No
0
No
0
No
0
No
0
2
No
0
No
0
No
0
No
0
No
...
0
No
0
No
0
No
0
No
0
No
5 rows × 210 columns
Removing tasks of no interaction data: Next, we will remove tasks with no interaction data. There are a few tasks in the instructional trajectory where no students interacted with. Before proceeding to the modeling step, we will remove all such tasks. The following tasks are the ones we will remove from our processed dataset.
Code
# removing tasks without any interactionscols_to_remove = []for col in df.columns:if'attempts'in col: col_parts = col.split('_') vals =list(df[col].unique())iflen(vals) ==1: cols_to_remove.append(col) cols_to_remove.append('_'.join(col_parts[:3]) +'_success')# removing tasks df.drop(cols_to_remove, axis=1,inplace=True)
Our dataset now contains only tasks which have some interactions data.
Converting the number of attempts into a categorical feature: We will now convert the number of attempts into three categories: zero, low (1), and high(2). We will use the following rules to convert the number of attempts into categories.
0: if the number of attempts is 0 representing the student has not interacted with the task.
1: if number of attempts is less than or equal to the median of attempts for the same task.
2: if the value is higher than the median value.
Code
import numpy as npdef num_to_categ(x, m):""" This function discretize the value of x into three categories. Args: x (int): value to discretize Returns: m (int): one of three categories """if x > m:2.0elif x is np.nan:return0.0else:returnfloat(x)for col in df.columns:if'attempts'in col: df[col]=df[col].astype(float)#df[col].fillna(0, inplace=True) df[col] = df[col].apply(num_to_categ, m=df[col].median())#df[col]=df[col].astype(str)#df[col] = df[col].apply({0:'zero',1:'low',2:'high'}.get)df_ = df.fillna(0)df_.head()
E1_A1_T1_attempts
E1_A1_T1_success
E1_A2_T1_attempts
E1_A2_T1_success
E1_A2_T2_attempts
E1_A2_T2_success
E1_A2_T3_attempts
E1_A2_T3_success
E1_A3_T1_attempts
E1_A3_T1_success
...
E12_A3_T1_attempts
E12_A3_T1_success
E12_A3_T2_attempts
E12_A3_T2_success
E12_A3_T3_attempts
E12_A3_T3_success
E12_A3_T4_attempts
E12_A3_T4_success
E12_A3_T5_attempts
E12_A3_T5_success
0
0.0
No
0.0
No
0.0
No
0.0
No
0.0
No
...
0.0
No
0.0
No
0.0
No
0.0
No
0.0
No
0
0.0
No
0.0
No
0.0
No
0.0
No
0.0
Yes
...
0.0
Yes
0.0
Yes
0.0
No
0.0
No
0.0
No
0
1.0
No
0.0
No
0.0
No
0.0
No
0.0
Yes
...
0.0
No
0.0
No
0.0
No
0.0
No
0.0
No
0
0.0
No
0.0
No
0.0
No
0.0
No
0.0
Yes
...
0.0
No
0.0
No
0.0
No
0.0
No
0.0
No
0
0.0
No
0.0
No
0.0
No
0.0
No
0.0
Yes
...
0.0
No
0.0
No
0.0
No
0.0
No
0.0
No
5 rows × 172 columns
3 Buidling a Bayesian network
Now, we will move to building a Bayesian network and learn probabilities from our log dataset. In our dataset, we have interaction data (e.g., number of attempts). Additionally, we have information about which skill is associated with which task. Those skills, however, are directly observable, also referred to as latent variables.
Our goal is to build a network using observable (interaction features) and unobservable traits (skills), and learn conditional probabilities utilizing our log data. For this task, we will use the Expectation Maximization algorithm which allows the estimation of probabilities for latent variables.
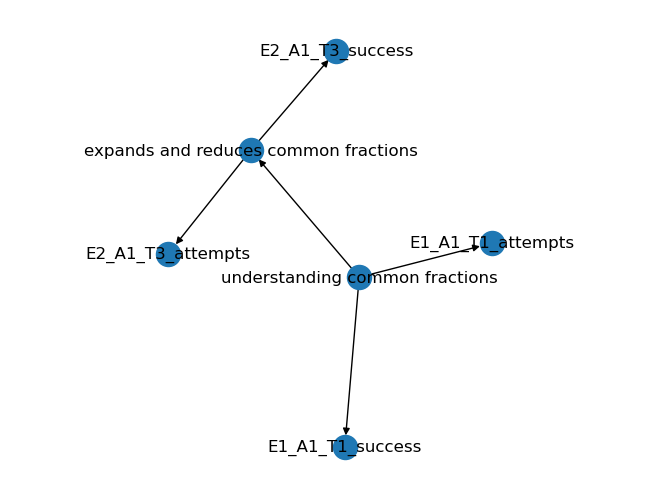
3.1 Network structure
As the first step, we will build a network structure where we will specify nodes (or variables) and the relationship between those nodes. Figure 2 shows a part of our network structure. We can see that the skill expands and reduces common fractions requires the skill of understanding common fractions. Also, these skills influence the number of attempts and success on tasks associated with them. For example, task E1_A1_T1 is associated with understanding common fractions; a student with a strong hold on the skill is likely to respond to the task correctly with relatively a lesser number of attempts in comparison with another student with a weak understanding of that skill.
Code
import networkx as nximport matplotlib.pyplot as pltfrom pyvis.network import Networkg = nx.DiGraph()g.add_edges_from([('understanding common fractions','expands and reduces common fractions'), ('understanding common fractions','E1_A1_T1_attempts'), ('understanding common fractions','E1_A1_T1_success'), ('expands and reduces common fractions','E2_A1_T3_attempts'), ('expands and reduces common fractions','E2_A1_T3_success')])nx.draw(g, with_labels=True)plt.margins(x=0.4)plt.show()
Figure 2: Partial structure of the network
Code
skills_df = pd.read_csv('task_skills.csv')latent_variables = ['understanding common fractions','expands and reduces common fractions','understanding algebraic fractions','projecting operations of expanding and reducing common fractions','expands and reduces algebraic fractions','projecting operations of multiplication of common fractions','multiplies algebraic fractions', 'divides algerbaic fractions','adds and substracts of algebraic fractions','projecting operations of adding common fractions','II 5','III 4','III 5']def get_task_skill(df, task):""" This function returns the learning outcome associated with the specified task. Args: df (DataFrame) : Pandas DataFrame object of logs data task (str) : Task for which to return learning outcome Returns: str: learning outcome """return df.loc[df['task_heirarchy'] == task, 'learning_outcome'].values[0]def print_full(cpd):""" Function to print full CPDs table. """ backup = TabularCPD._truncate_strtable TabularCPD._truncate_strtable =lambdaself, x: xprint(cpd) TabularCPD._truncate_strtable = backup# preparing edges for Bayesian networkedges = []for index in skills_df.index: record = skills_df.iloc[index].values task = record[0] high_skill = record[1] high_skill = high_skill.split(')')[0] skill = record[2] task_attempts =f'{task}_attempts' task_success =f'{task}_success'if task_attempts in cols_to_remove or task_attempts notin df.columns or task_success notin df.columns:continue edges.append((high_skill, skill)) edges.append((skill, task_attempts)) edges.append((skill, task_success)) edges.append((task_attempts, task_success))# adding dependency from skill networkedges_ =list(set(edges))edges_.append(('understanding common fractions','expands and reduces common fractions'))edges_.append(('II 5','III 4'))edges_.append(('II 5','III 5'))edges_.append(('III 4','III 5'))edges_.append(('understanding algebraic fractions','expands and reduces algebraic fractions'))edges_.append(('expands and reduces algebraic fractions', 'adds and substracts of algebraic fractions'))edges_.append(('adds and substracts of algebraic fractions','multiplies algebraic fractions'))edges_.append(('multiplies algebraic fractions','divides algerbaic fractions'))edges_.append(('projecting operations of expanding and reducing common fractions', 'projecting operations of multiplication of common fractions'))edges_.append(('projecting operations of multiplication of common fractions','projecting operations of adding common fractions'))
Let’s have a look at the complete network. Figure 3 shows the complete structure of our network.
Code
nx_graph = nx.DiGraph()nx_graph.add_edges_from(edges_)nt = Network('800px', '1000px',notebook=True,directed =True,cdn_resources='in_line')# populates the nodes and edges data structuresnt.from_nx(nx_graph)nt.show('nx.html')
nx.html
Figure 3: Complete network structure
3.2 Estimating probabilities for skills
Now, we will use our network structure and apply an estimation algorithm, i.e., Expectation Maximization (EM). The EM algorithm could be used when the network involves some latent variables (or variables for which data is unavailable) to learn their probabilities.
The following code applies the EM algorithm and learns probabilities. Some of those probabilities are shown below.
Code
from pgmpy.models import BayesianNetworkimport networkx as nxfrom pgmpy.estimators import ExpectationMaximization as EMfrom pgmpy.factors.discrete.CPD import TabularCPD# building bayesian networknew_G = BayesianNetwork(edges_, latents={'understanding common fractions','expands and reduces common fractions','understanding algebraic fractions','projecting operations of expanding and reducing common fractions','expands and reduces algebraic fractions','projecting operations of multiplication of common fractions','multiplies algebraic fractions', 'divides algerbaic fractions','adds and substracts of algebraic fractions','projecting operations of adding common fractions','II 5','III 4','III 5'})# initializing EM estimatorestimator = EM(new_G, df_)# estimating parametersall_cpds = estimator.get_parameters(max_iter=2)print_full(all_cpds[0])
3.3 Assigning learned probabilities to the Bayesian network
As we have probabilities learned from the log data using Expectation Maximization algorithm, we will use them to initialize our Bayesian network. Now, this network can be used for inference purposes.
Code
bayes = new_G# setting conditional probabilitiesfor cpd in all_cpds: bayes.add_cpds(cpd)
3.4 Performing inference using the network
Now we will use our network to infer probabilities for different skills given a student’s interaction data with some tasks. For this illustration, we will use interaction data from all the tasks from the trajectory. This should be noted that partial interaction data can also be used. For example, interaction with a single task or activity.
3.4.1 Visualizing the network with probabilities
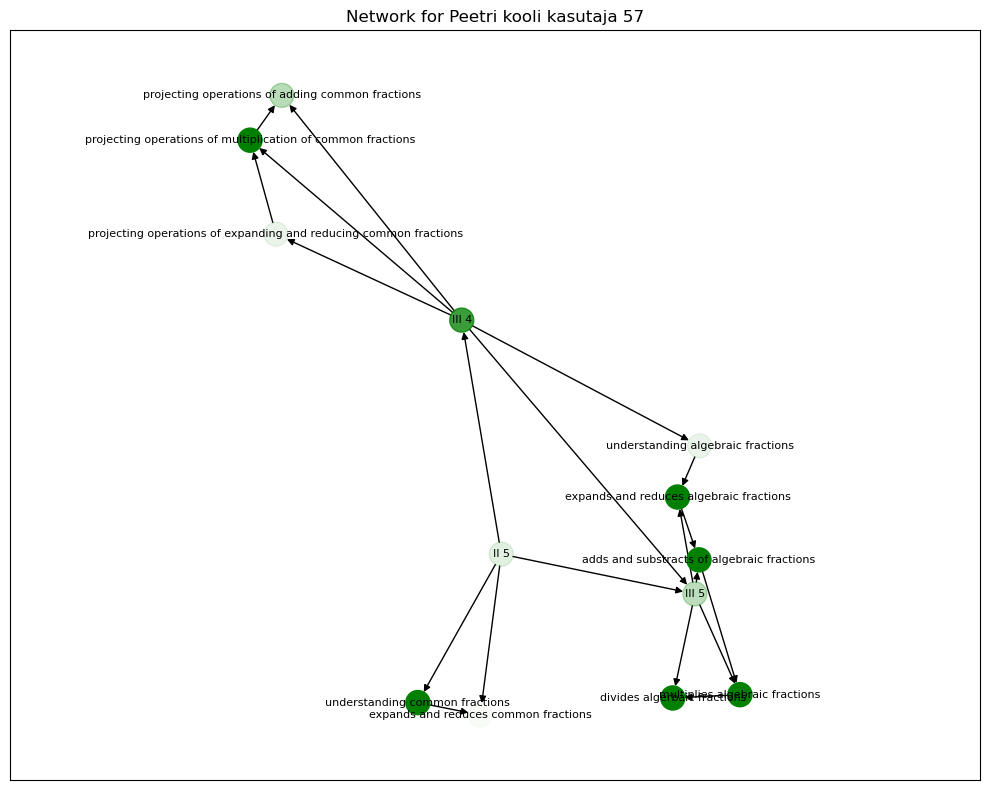
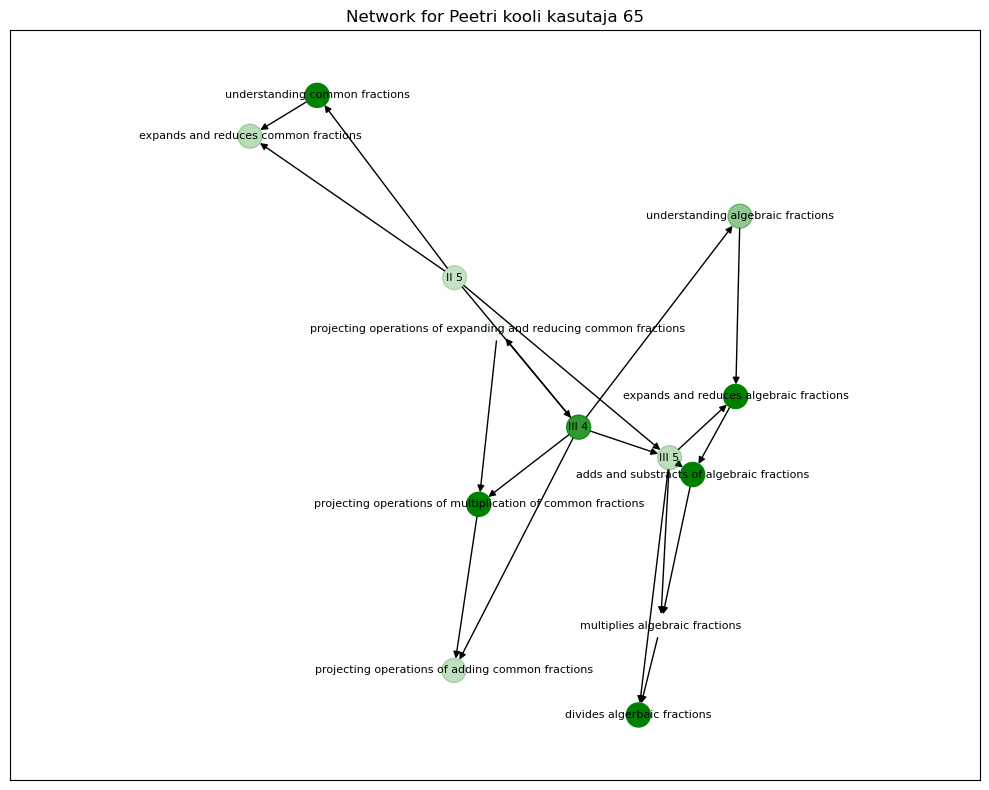
For an intuitive interpretation of the resultant probabilities for skills, we will now plot the network with the probabilities updated according to the student’s interaction with the tasks.
Let’s use interaction data of a particular student with id Peetri kooli kasutaja 56. We will first obtain the probabilities for different skills given the student’s interaction, and then we will plot the network with the obtained probabilities as the color of the nodes.
Figure 4 and Figure 5 below show the networks for two different students.
Code
from pgmpy.inference import VariableEliminationdf_student = df_.copy()df_student.reset_index(inplace=True, drop=True)# fetching a student's recorddef show_prob_for_student(id, bayes):""" This function prints probabilities for a particular student. Args: id (int): index of student in the log dataset bayes (BayesianNetwork): Bayesian network (from pgmpy) """#print('Student ID:',data.iloc[id,0])# inititing inference engine infer = VariableElimination(bayes)# accessing student record student_record = df_student.iloc[id].to_dict()#removing task which were not added to the network evidence = {}for key, value in student_record.items():if key in bayes.nodes(): evidence[key] = value# creating a network for student student_graph = nx.DiGraph() edges = []for index in skills_df.index: record = skills_df.iloc[index].values task = record[0] high_skill = record[1] high_skill = high_skill.split(')')[0] skill = record[2] edges.append((high_skill, skill))# adding dependency from skill network edges_ =list(set(edges)) edges_.append(('understanding common fractions','expands and reduces common fractions')) edges_.append(('II 5','III 4')) edges_.append(('II 5','III 5')) edges_.append(('III 4','III 5')) edges_.append(('understanding algebraic fractions','expands and reduces algebraic fractions')) edges_.append(('expands and reduces algebraic fractions', 'adds and substracts of algebraic fractions')) edges_.append(('adds and substracts of algebraic fractions','multiplies algebraic fractions')) edges_.append(('multiplies algebraic fractions','divides algerbaic fractions')) edges_.append(('projecting operations of expanding and reducing common fractions', 'projecting operations of multiplication of common fractions')) edges_.append(('projecting operations of multiplication of common fractions','projecting operations of adding common fractions'))# adding edges to the network student_graph.add_edges_from(edges_) alpha_map = []# performing inference# using proabilities as alpha values for node colorfor skill in student_graph.nodes(): prob = infer.query([skill], evidence=evidence) alpha_map.append(prob.values[1]) plt.figure(figsize=(10,8)) pos = nx.fruchterman_reingold_layout(student_graph) nx.draw_networkx_nodes(student_graph,pos,node_color='green',alpha=alpha_map) nx.draw_networkx_labels(student_graph, pos, font_size=8) nx.draw_networkx_edges(student_graph, pos, edgelist=edges_, arrows=True) plt.margins(x=0.4) plt.title(f'Network for {data.iloc[id,0]}') plt.tight_layout() plt.show()