Student modeling using log data from instructional trajectories
python
bayesian networks
open learner models
Author
Pankaj Chejara
Published
May 28, 2024
This post presents a step-by-step process employed to model students’ knowledge using interaction log data. For the analysis, log data from an educational tool, named vara, have been used.
Vara is a sandbox platform built upon Drupal to facilitates the implementation of research ideas in the educational domain. This tool allows teachers/researchers to create H5P-based learning materials. Additionally, the tool records students’ interactions in the form of log data.
This post analyzes those interaction data in the context of new functionality added to the Vara, i.e., instructional trajectories. The instructional trajectory is a way to group learning materials and provide a structure among those groups of learning materials. Each subject is decomposed into groups known as Episodes which focus on a particular concept in the subject. Each episode is further decomposed into Activities which are then further divided into Tasks. Each task has a pre-specified skill(s) associated with it.
1 Exploring log dataset
The goal is to generate open learner models using a log dataset of instructional trajectories. The log dataset contains students’ interaction with each task. More concretely, each interaction is recorded in the form of a set of attributes, e.g., time spent, number of attempts, score, number of times hints used, etc.
Answer (left empty if library is not supported).104
0
Piret Koppel
49m 46s
NaN
E1
A1
0
T1
Yes
NaN
0
...
NaN
NaN
T5
Yes
NaN
0
0
No
NaN
NaN
1
Peetri kooli kasutaja 56
983h 30m
NaN
E1
A1
0
T1
Yes
228.0
2
...
NaN
NaN
T5
Yes
NaN
0
0
No
NaN
NaN
2
Peetri kooli kasutaja 57
983h 31m 33s
NaN
E1
A1
0
T1
Yes
177.0
1
...
NaN
NaN
T5
Yes
NaN
0
0
No
NaN
NaN
3
Peetri kooli kasutaja 58
983h 28m 49s
NaN
E1
A1
0
T1
Yes
10.0
5
...
NaN
NaN
T5
Yes
NaN
0
0
No
NaN
NaN
4
Peetri kooli kasutaja 59
843h 35m 32s
NaN
E1
A1
0
T1
Yes
48.0
2
...
NaN
NaN
T5
Yes
NaN
0
0
No
NaN
NaN
5 rows × 911 columns
Each record in the dataset presents a particular student’s interaction with all the tasks in the instructional trajectory. There are several instances when students have not interacted with tasks. In those cases, missing values were recorded for interactions.
2 Preprocessing data
As the first step, we will transform the dataset from its current form to a form where each record represents a student’s interaction with a single task.
Code
# pre-processing codeslabels = {0:'required',1:'time',2:'attempts',3:'hints',4:'success',5:'score',6:'answer',7:'---'}def extract_data(row_data):""" This function process records from log data obtained from vara on instructional trajectories. Args: row_data (dict): row record in dictionary format Returns: records : a dictionary containing processed records """ current_episode ='' current_activity ='' current_task ='' records = {}for item in row_data: current_record = {} item =str(item)if'E'in item and'H5P'notin item: current_episode = itemelif'A'in item and'H5P'notin item: current_activity = itemelif'T'in item and'H5P'notin item: current_task = item start =0elif'H5P'in item or'library'in item or':'in item:continueelse:if current_episode ==''or current_activity ==''or current_task =='':continueelse:ifnot start >6: records[f'{current_episode}_{current_activity}_{current_task}_{labels[start]}'] = item start +=1 save_records = {} processed_record = recordsfor key, value in processed_record.items(): parts = key.split('_') heirarchy ='_'.join(parts[:3])if heirarchy notin save_records.keys(): save_records[heirarchy] = {} save_records[heirarchy][parts[3]] = valuereturn save_recordsdef get_df(data):"""This function transforms current csv file into a pandas DataFrame. The dataframe contains response to each task as a seperate entry. Args: data (DataFrame): Pandas DataFrame of csv file of instructional trajectories logs Returns: df (DataFrame): Processed dataframe """ cols = ['student','task_heirarchy','required','time','attempts','hints','success','score']# initialise the dataframe df = pd.DataFrame(columns=cols)# iterate over each record in datafor index in data.index.to_list():# accessing current record in dict form cur_record = data.iloc[index].to_dict()# dict for processed record save_record = {}# studen information save_record['student'] = cur_record['Student']# convert each record into task-wise records processed_records = extract_data(data.iloc[index])# iterate for each taskfor task, values in processed_records.items(): save_record['task_heirarchy'] = taskfor val_key, val_val in values.items(): save_record[val_key] = val_val# save a record of students' response to each task seperately df = pd.concat([df, pd.DataFrame([save_record])], ignore_index=True)return df
Code
# transforming the datasetdf = get_df(data)# converting object data types to numericdf['time'] = pd.to_numeric(df['time'],errors='coerce')df['hints'] = pd.to_numeric(df['hints'],errors='coerce')df['attempts'] = pd.to_numeric(df['attempts'],errors='coerce')# removing hints because all the values are 0# removing answer df_ = df.drop(['hints','answer'], axis=1)df_.tail(10)
student
task_heirarchy
required
time
attempts
success
score
2538
Peetri kooli kasutaja 78
E12_A1_T6
No
343.0
5
Yes
4/4
2539
Peetri kooli kasutaja 78
E12_A1_T7
No
NaN
0
No
nan
2540
Peetri kooli kasutaja 78
E12_A2_T1
Yes
NaN
0
No
nan
2541
Peetri kooli kasutaja 78
E12_A2_T2
Yes
NaN
0
No
nan
2542
Peetri kooli kasutaja 78
E12_A2_T3
No
NaN
0
No
nan
2543
Peetri kooli kasutaja 78
E12_A3_T1
Yes
NaN
0
No
nan
2544
Peetri kooli kasutaja 78
E12_A3_T2
No
NaN
0
No
nan
2545
Peetri kooli kasutaja 78
E12_A3_T3
No
NaN
0
No
nan
2546
Peetri kooli kasutaja 78
E12_A3_T4
Yes
NaN
0
No
nan
2547
Peetri kooli kasutaja 78
E12_A3_T5
Yes
NaN
0
No
nan
The above dataset now contains transformed data. Each record (line) represents interaction with a single task. For example, the record number 2538 presents interaction-related information for a user (Peetri Kooli kasutaja 78) interacting with a task E12_A1_T6. The task contains information about Episode as well as Activity. For example, E12_A1_T6 represents a task T6 in Episode 12 Activity 1.
3 Student modeling using logs
Now, we will move further toward building students’ knowledge networks using bayesian modeling. For our exploration, we will focus on a short part of the dataset.
Let’s extract data on a particular student’s interaction with tasks of a particular Episode. The following code extracts data for a user (78) and episode 11.
Code
ep_df = df_.loc[df_['task_heirarchy'].str.contains('E11'),:]# df for student Peetri kooli kasutaja 78ep_78 = ep_df.loc[ep_df['student'] =='Peetri kooli kasutaja 78',:]# saving the resultant dfep_78.to_csv('ep_78.csv', index=False)
3.1 Assiging skills for each task
Next, we will specify skills targeted by each task. Here, one or more than one skill can be associated with each task. In our current dataset, we don’t have that information.
Therefore, to allow our exploration, we have added some dummy skills (e.g., A, B, C) to our processed dataset.
Code
# reading Peetri kooli kasutaja 78, Episode 11 data with dummy skillsep_78_skills = pd.read_csv('ep_78_with_skills.csv')def score_to_num(x):""" This function takes a string in the form n1/n2 and returns the result of dividing n1 by n2. """if x isNone:return-1else: f = x.split('/')[0] s = x.split('/')[1]returnfloat(f)/float(s)# transform each score into a numberep_78_skills['score_'] = ep_78_skills['score'].apply(score_to_num) ep_78_skills.head()
student
task_heirarchy
required
time
attempts
success
score
skill
score_
0
Peetri kooli kasutaja 78
E11_A1_T1
Yes
30.0
4
Yes
3/3
A
1.0
1
Peetri kooli kasutaja 78
E11_A1_T1
Yes
30.0
4
Yes
3/3
B
1.0
2
Peetri kooli kasutaja 78
E11_A1_T2
No
23.0
5
Yes
3/3
B
1.0
3
Peetri kooli kasutaja 78
E11_A1_T3
No
27.0
2
Yes
3/3
A
1.0
4
Peetri kooli kasutaja 78
E11_A1_T3
No
27.0
2
Yes
3/3
C
1.0
The above snapshot shows the current state of the dataset after adding skills and converting scores into numbers. Next, we will transform skill attribute into three different binary variables one for each skill.
Code
# generating binary variables for each skillep_78_skills_dummy = pd.get_dummies(ep_78_skills['skill'])# concatenating dataframesfinal_ep_78 = pd.concat([ep_78_skills[['required','time','attempts','score_']],ep_78_skills_dummy],axis=1)# printingfinal_ep_78.head()
required
time
attempts
score_
A
B
C
0
Yes
30.0
4
1.0
True
False
False
1
Yes
30.0
4
1.0
False
True
False
2
No
23.0
5
1.0
False
True
False
3
No
27.0
2
1.0
True
False
False
4
No
27.0
2
1.0
False
False
True
3.2 Creating Bayesian network
Now, we will use our processed dataset and build a Bayesian network. There could be different goals here, e.g., learning network structure or dependence among skills and attributes; learning conditional probabilities of an already given network.
Our focus is on the second case, i.e., learning conditional probabilities given a network structure. To do that we will assume some dummy relationship among skills and attributes (this structure could come from a domain expert as well for real-world cases).
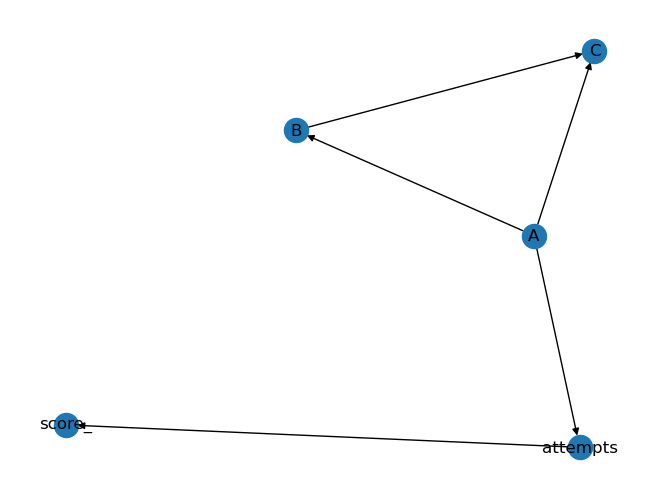
Our assumed structure is
A -> B -> C
A -> C
A -> attempts
attempts -> score_
The above structure tells that skill C is dependent on skill B and A. Skill B is dependent on skill A. The number of attempts made by students for tasks of skill A is dependent on skill A. In simple terms, it means that a student proficient in skill A is likely to have a smaller number of attempts when answering tasks associated with skill A. The number of attempts has an impact on the score achieved. There could be more relationships, however, for our example, we are keeping it short.
Important
We are using attemps and score attributes for tasks associated with the skill A to make the example simple. These attributes along with others (e.g., hints) should be used for each skill for modeling purposes.
Code
# importing librariesfrom pgmpy.models import BayesianNetworkimport networkx as nximport pylab as plt# building network structuremodel = BayesianNetwork([('A', 'B'), ('A', 'C'), ('B', 'C'), ('A','attempts'), ('attempts','score_'), ])# plotting the networknx_graph = nx.DiGraph(model.edges())nx.draw(nx_graph, with_labels=True)plt.show()
Code
Once we have our network structure, we can learn the parameters using our dataset.
Code
# fitting the datasetmodel.fit(final_ep_78)# printing conditional probabilitiescpds = model.get_cpds()for cpd in cpds:print(cpd)
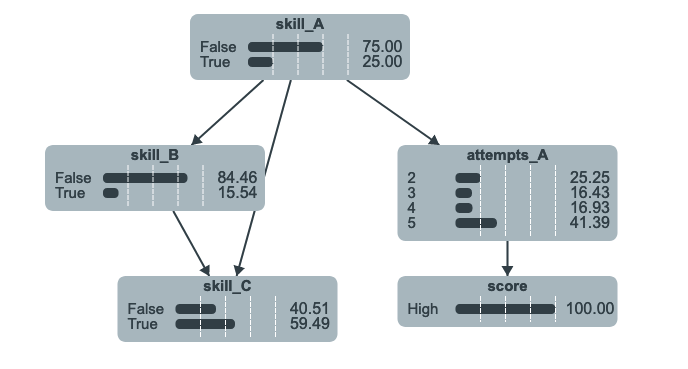
As a result of learning, we have now conditional probabilities for each of our nodes. These conditional probabilities can be used to visualize the Bayesian network in the following way.
The visualization given below is generated by a JS library jsbayes-viz.
vis.png
Note: In our exploration, we only used interaction data from Episode 11 and used only two attributes attemps and score for the skill A only. The goal was to demonstrate the process of student modeling using log data. These attributes can be utilized for other skills as well.